|
My digital project was to create an Omeka exhibit discussing the everyday uses of civilian firearms. This means I was using digital tools not for analysis or research, but for presenting analysis and research. Most of the research for the project I had already done for another class, but the process of creating an exhibit forced me to think about it in new ways.
First I had to think about organization. Since exhibits are object-centered, and since Omeka is object-centered, I had to present and organize the information around objects. My objects would obviously be firearms, but there are many different 18th century firearms to choose from. I decided to pick the most common firearms, and discuss each individually, making each type of firearm its own page. This allows me to present the information in a straightforward and easy to understand way, highlighting the strengths and weaknesses of each type individually, which I felt would be ideal for an audience unfamiliar with 18th century weapons. I considered displaying the firearm types mixed together, with each exhibit page being organized around uses. This would make it easier to compare and contrast the firearms, but I decided it would be unnecessarily complex. I chose to avoid firearms with specific military uses, such as wall-guns, as they would not be owned by civilians and are not very common anyway. I was not sure if I should include pistols, but I decided they would be an excellent counter to the other weapons, and would help make the point that there is a big difference between elite and common firearms. Making an exhibit also forced me to break information into manageable chunks that still supported each other. I found myself often moving information between the main exhibit page text and the captions on the firearms. Unfortunately, this means some information I exported to the captions is relevant to the firearm being discussed but not directly relevant to the specific picture of the firearm the caption is attached to. The process of exhibit making also made me distill the most important information about civilian firearms out of the pages of research I had on them. Good exhibit labels need to be short, and writing short labels that are engaging is always a difficult process which requires cutting away at extra information to get at the core points. However, the end result is a concise, user-friendly presentation that makes the same points which could be made in an academic paper, but for a public audience. One of the greatest benefits of a good exhibit is its ability to make complex arguments understandable to varied audiences. One of the benefits of digital history is its ability to reach large audiences. Combined, this gives historians a great avenue for presenting their research.
0 Comments
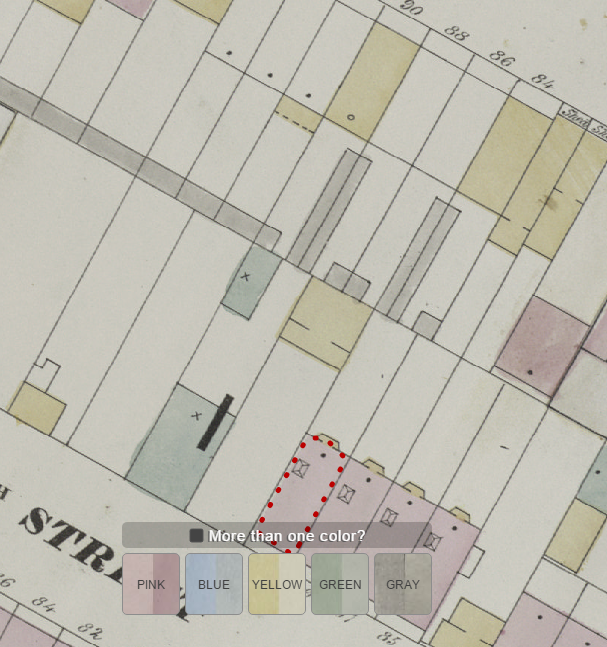
Finally I tried the find place names tool, where you scroll around the map and click to type in names of places. This I enjoyed, because I had freedom to explore the map as I wished. I also found it interesting to see what others did and didn’t previously label. Often, simple things like schools or shops were already labelled, but often long or complicated places were not. This could either be out of laziness (it takes a bit to more effort to type Church (Episcopal)(Slate Roof)) or out of confusion (often abbreviated places would not be labelled, such as Ceramics Manu’try). I also noted that lots of church schools, appearing as School &c. were not attempted, while public schools labelled School were. It’s as if the &c. is too foreign and confusing to most users that they avoided transcribing it. Still, this mode would be more fun if I lived in NYC and knew the neighborhoods I was labelling. 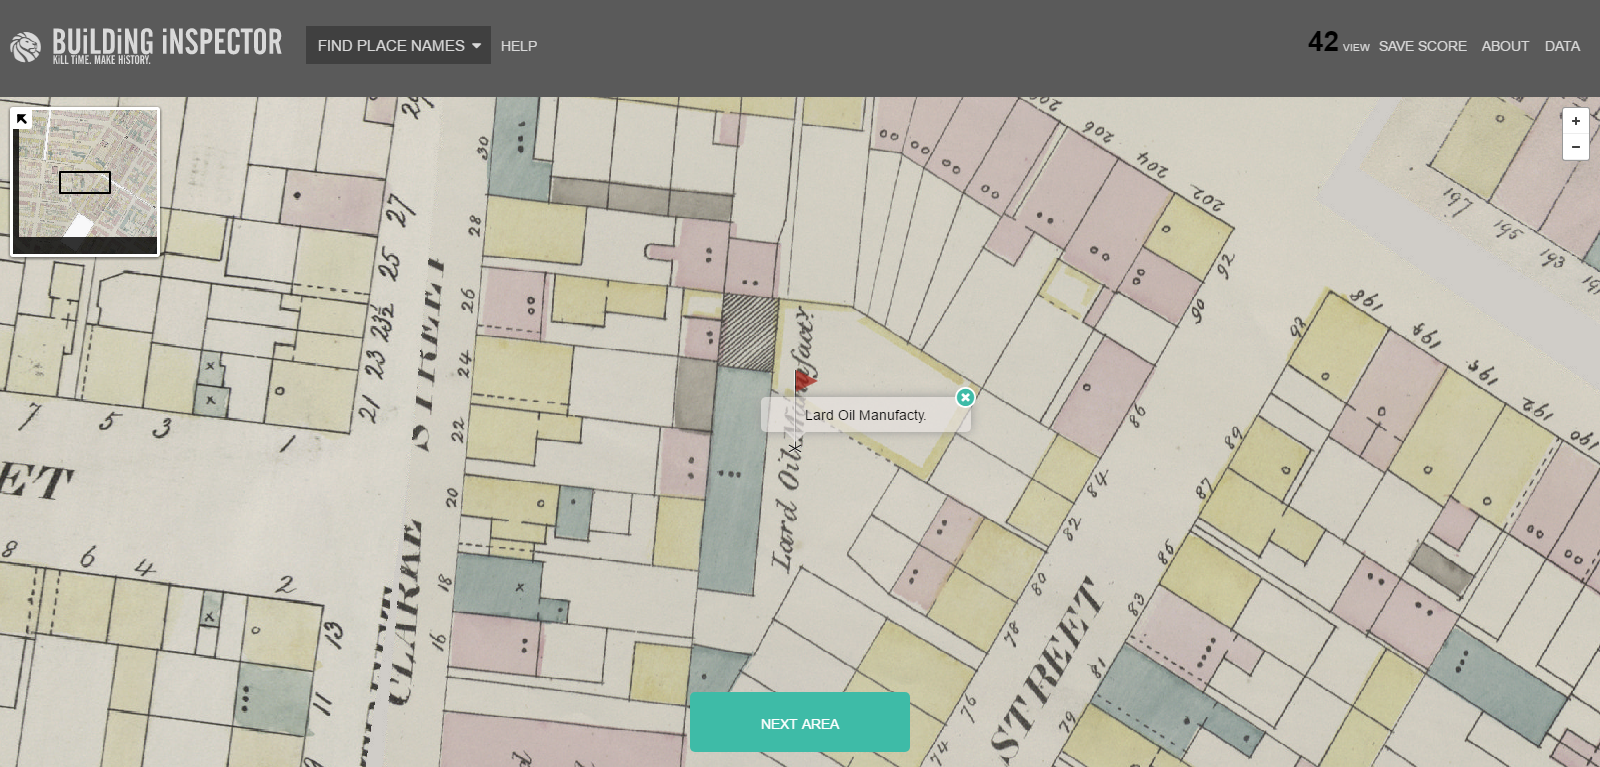 Mmmm lard oil...sounds delicious The project uses crowdsourcing to check and augment the heavy lifting done by its computer system. The idea is to eventually create what they call a NYC “time machine;” a historic map database searchable by address that can display layers of what was at that address in the past. Not only is that a cool project but it will also make research much easier for historians interested in NYC, urban history, or many other things, but also make research and historical method much more accessible to the public. People could, themselves, discover the history of their own residence and neighborhood. Such a direct and tangible immediate connection to history has a lot of power and can be utilized well by public historians and educators. Participating in the crowdsourcing allows users part of that connection. So I think as a project in both current and finished form, the building inspector is right to use crowdsourcing.
Just an FYI, my Omeka site is up and running. Check out my exhibit on weapons and what they tell us about the cultures that made them. I built the exhibit around a core of pictures and research I did for my internship at the Lisanby museum, with a surprise thrown in at the end, just to get visitors thinking.
derekenglehistory.omeka.net/exhibits/show/weapons-and-culture This is different from the Omeka exhibit I'm planning for my final project. So keep watching for that.
I created a map of the British defenses of Philadelphia in 1777. I chose to show all the redoubts built by the British because they show the strong points in the British land defense. I also chose to show British coastal defenses along the Delaware meant to defend the city from waterborne raids to form a more complete picture of their defenses.
Creating this map gives me a tool to understand the British tactical situation in Philadelphia during the occupation. It shows that they expected a land attack from the North, or at least felt that was the most vulnerable part of the city. It also shows they primarily relied on the Schuylkill River for their western defense, and the Delaware for their southern and eastern defenses. All of this makes sense, as both rivers would make formidable barriers to attack if defended properly, while the north would be vulnerable without entrenchments. The coastal defenses, consisting of a few cannon mounted in batteries, shows they expected nothing more than a harassing force from the river, incapable of serious threat, which is a fair assessment of the American navy at the time. Combined with other sources, this could be used as anything from a study of British tactics to a study of the role of terrain in warfare to even showing what parts of Philadelphia were considered important to defend.
One problem I had with creating this map was my source. I used a list of Philadelphia defenses provided by the American Forts Network. While their website does have a bibliography, I did not check their sources for myself. I would not be comfortable using this map in my work until I got to examine the original sources myself. I also had trouble with some of the street names for streets that have changed or no longer exist, so I used the David Rumsey map collection to cross-reference everything with an old map of Philadelphia overlayed on a current map to place my points. Also, four of the redoubts were listed as having an unknown location, which could affect my analysis if they were placed to the west or south, for example. As a sidenote, one random feature of Google Maps that I like is the ability to import custom icons, which can be easily made in GIMP for example. This may be mostly a cosmetic feature, and not really affect my analysis, but they seem to fit my map so much better than the standard Google pinpoint. You can view my map here And here is the list of defenses I used My project will be to create an Omeka exhibit on 18th century firearms in America. Most museums that display firearms are either art or war museums, and they typically display only ornate, elite, or military firearms. However, my exhibit will primarily focus on civilian ownership and uses of firearms rather than military. It will also focus on commonplace, average firearms instead of those that are ornate and elite. My exhibit will cover diverse firearms including the fowlers and fusils, muskets, and rifles that everyday Americans would have used. It will provide interpretation for each of them, as well as emphasizing their civilian and everyday uses. My hope is that my exhibit will broaden its visitor’s understanding of just how common firearms were in early America, and show that they had many everyday uses beyond warfare. Hopefully this will also educate visitors to some differences between 18th century civilian and military weapons and provide useful historical context for current firearm-related issues such as gun control.
Digital tools such as Omeka are ideal to explore this subject for several reasons. First, Omeka is suited to this project because it is built for museums and centered around objects. Also, mounting an actual exhibit in a museum may be a better way to go about this project at least for visitors who could access the museum. However, mainline history museums are often reluctant to display firearms. Art museums that do display firearms are primarily concerned about displaying them as art, while history museums which display them are typically military or war museums who obviously display them in the context of war. It is much less risky to create an online exhibit with firearms than a physical one, and if such an exhibit was successful, it might prompt mainline history museums to consider a similar physical exhibit. Also, a digital exhibit can reach much bigger audiences since it is much more accessible. The commonality and civilian uses of firearms in the 18th century is well established in traditional research. Detailed probate inventory analysis even suggests they were as commonly owned as books of any kind, and more commonly owned than chairs or Bibles. However, public audiences are likely not aware of this body of research, and this exhibit would be one way to make this research public. My intended audience is adult Americans who have little previous exposure to 18th century firearms. This means I will have to keep my discussion of firearms in general terms instead of using the jargon that gun collectors and aficionados would use. My audience also includes those from both sides of the current gun debate. I will need to bear in mind that this is a very volatile issue so I avoid upsetting my audience and causing them to learn nothing from my exhibit. I got drawn into using Google Ngrams for my data visualization, and unfortunately found it to be a much less powerful and versatile tool than I would like. It all started when I was messing around in Ngrams with various terms for weapons. Did writers use concrete terms like flintlock or rimfire, less concrete terms like musket, pistol or rifle, or very vague terms such as gun? I decided I wanted to expand this investigation with a better tool but still using Google’s corpus, when I got stuck. Google allows anyone to download their corpus (good), however it turns out this would be a complicated and lengthy project (bad). Their corpus is actually text files with word counts generated from Google books, organized to be machine-readable and posted in many small bits. This means it would be very laborious and confusing to download manually, and because of the format Google uses, it would be worthless to upload to Voyant or other text analysis tools. Instead, I would have to write a program to download and modify the files into a useful format or just write my own text analysis tool. Defeated, I decided to use Ngrams. 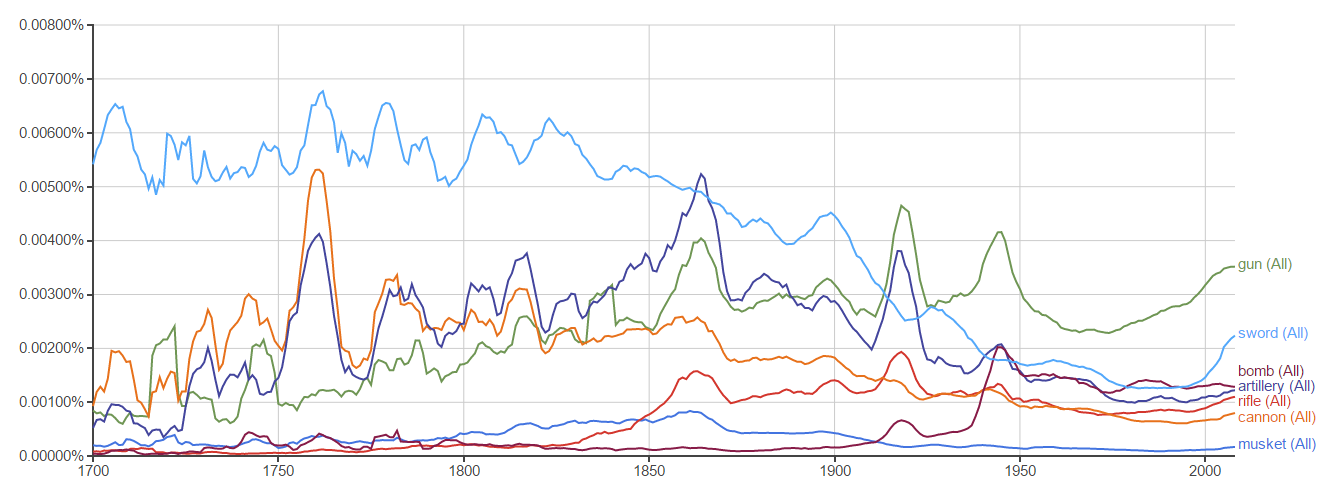 Ngram using all of Google's English corpus Before I settled on a final set of words, I explored many options. I started with a generic catch-all term, gun, as my baseline. I added the primary types of firearms, musket and rifle, and then tried some melee weapons, such as sword and pike. I broadened the field with bigger weapons, adding artillery and cannon, and then added bomb, since it was a term in the 1700s which I expected would radically rise in usage when it changed meaning. Specific words, like matchlock, culverin, or howitzer, had so few mentions that they were only a line at the bottom. I also tried shell, but removed this because there’s no way to distinguish between artillery shells and animal shells. At this point the Ngram was so crowded I had to remove some things, so I took out the specific terms, since I can note they had very few hits without clogging the graph. I also took the melee weapons out from most of the graphs to get a better view of what was going on with the others. I explored going earlier than 1700, but Google doesn’t have enough data to tell me anything useful before that. Plus, firearms tech was still in its infancy during that time, and there weren’t really standard terms yet. 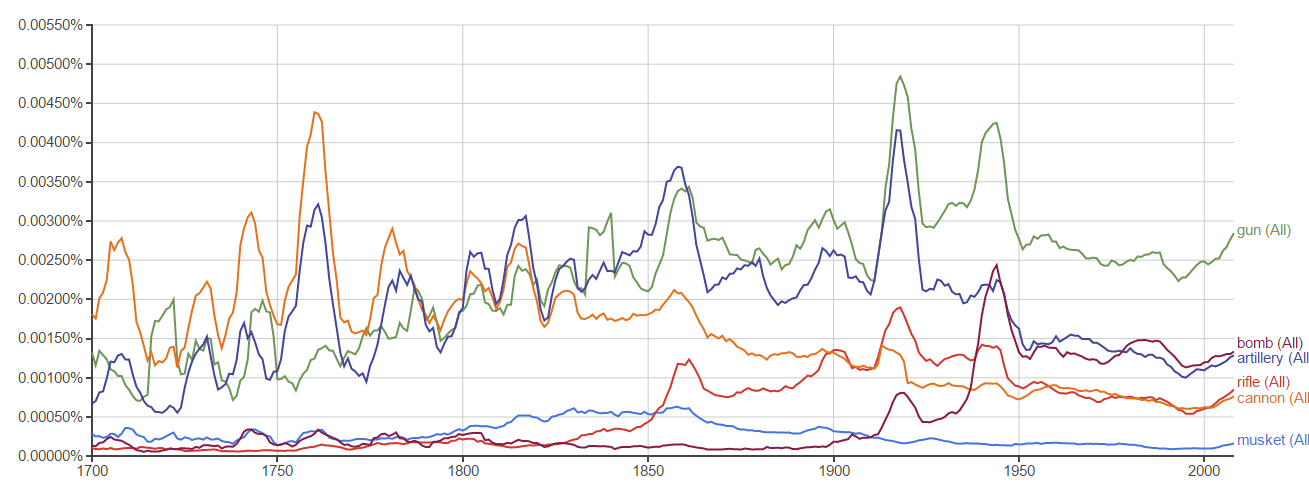 Ngram using Google's British English corpus Looking at my Ngrams, the first thing I noticed was the spikes in mentions of weapons during years of war. Not surprising. Right before 1850, rifle supersedes musket as the specific term of choice, just as rifles were then superseding muskets as the firearm of choice. Bomb also rises into much more common use around WWII, coming even with artillery with the advent of strategic bombing. Finally, gun is consistently the term of choice over rifle and musket, which could speak to general laziness or lack of knowledge when discussing firearms. I was surprised to see no spikes of weapon terms around the Vietnam War, Gulf War, or Iraq/Afghanistan wars. I was also surprised to see the prominence of swords until WWI, and their resurgence after 2000. 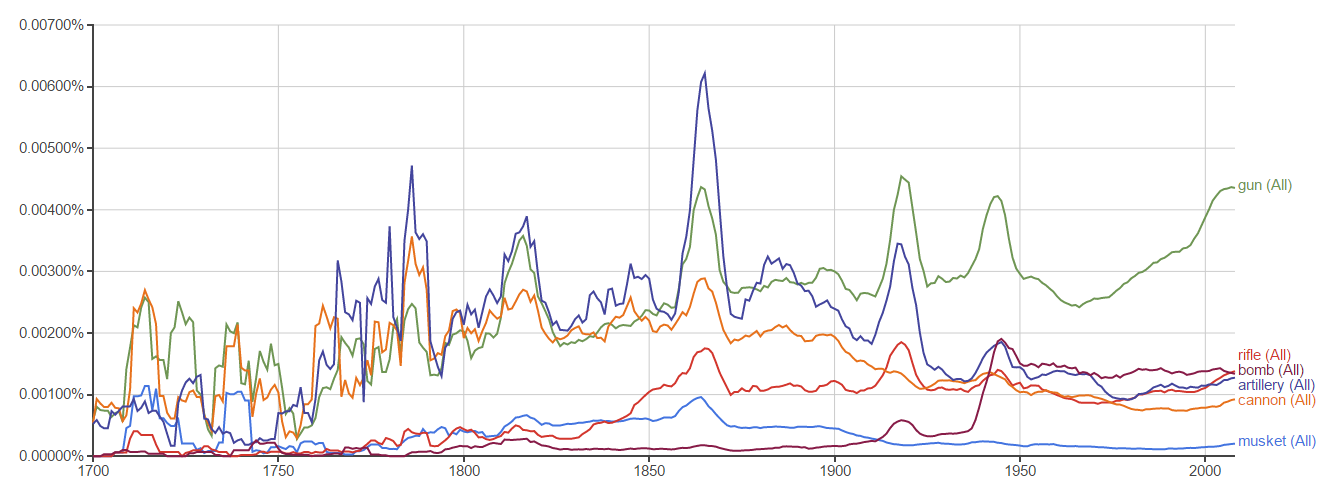 Ngram using Google's American English corpus I made additional Ngrams to compare British and American uses of weapon terms, but I’ve run out of space to discuss them.
Ngrams allows users to search google books for their terms in context, but it is nowhere near as helpful as similar features on other text analysis tools. It has helped me gain a general overview of the use of weapons terms, and provided one or two surprises that could be interesting to look in to. However, it is much less powerful than I would like. If I wanted to use this in a paper, I would have to do much more analysis and add several caveats before I would be comfortable drawing conclusions. But isn’t that what we do with all our sources? I chose to review The Geometry of War: Fortification Plans from 18th-Century America (find it here), an online exhibit hosted by the Clements Library at the University of Michigan. It is the online version of a temporary physical exhibit at the library which ran from October 2012 to February 2013. I chose it partly because of my interest in star forts but also because it fits into a broad practice of many museums which have begun to showcase past exhibits online. This exhibit is done in basic HTML format, with a sidebar allowing visitors to access each case, in any order, just as they could at a physical museum. Choosing one shows a picture of the case as a whole, with the text of its primary label, and then high-resolution scans of each object next to the text of their individual labels. Almost all of the objects are maps or designs of forts. Overall, the design is simple and easy to use, if not particularly engaging or alluring. It is great for someone who likes reading and has an interest in forts, but not so great for drawing in new audiences. Surprisingly, I think this exhibit works better online than in physical form. While I haven’t actually visited it in physical form, the pictures of each case provide a clue to what it was like: very text-heavy, hard to read labels and maps obscured by glass—I imagine myself leaning over the cases, squinting. However, on the internet, the text is much less intimidating for visitors. More importantly, while visitors lose the experience of having the real thing in front of them, the scanned images can be selected and viewed in much greater detail through the website. Additionally, museum objects presented online lose much of their effect by being flattened from 3D to 2D. However, for flat objects such as maps, this is not an issue. If I could add to this exhibit, I would include a 3D modeled virtual tour of one of the forts shown (perhaps Ft. Pitt?) discussing the importance of star forts by showing visitors how they worked. This would be interactive, allowing visitors to wander the fort, go to hotspots with demonstrations (cannons firing, soldiers working, etc.) and toggle various layers including siege works, fields of fire, and cutaway sections. I would also write an additional set of shorter, more concise labels, with a toggle for the visitor to choose between those and the current, more expansive labels. This would address the exhibit’s weaknesses by adding an engaging, 3D component and making the labels more accessible, while complementing its strengths of content and organization.
Hello everyone! I'm Derek Engle, and you've found my class blog for Digital History. I'm primarily interested in colonial American history, the French and Indian War, star forts, and material culture, but you can read more about me at the 'about me' tab if you're so inclined. Anyway, this blog will primarily be on subjects related to this class.
|
Voyages to the Past